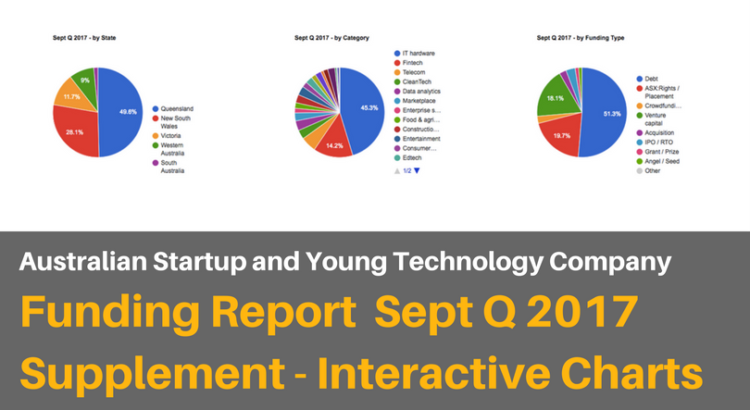
Since releasing our Australian Startup and Young Tech Company Funding Report for the September Quarter 2017 earlier this month we have been experimenting with some new tools to better enable our readers to extract useful insights from our data. We have set up some new interactive charts and table which enable readers to interrogate the data by state, company category or investment type. Have a play and let us know what you think.
As we have said before, we compile our reports from public data and from information reported to Techboard by companies or our investor Partners. We know our report is not comprehensive. We need your help to enable us to capture as much data as possible. If you would like to help out please contact us.
by: Peter van Bruchem
See our latest Funding Report:
December Quarter Funding Report Reveals over $720M in Funding
See More Techboard Interviews:

